
Significant global energy demand growth and rising living standards in China, India, and the Middle East, coupled with technological breakthroughs continue to alter the fundamentals of oil & gas production, creating unprecedented opportunities for U.S. oil & gas equipment exporters in the near-term. New technologies have allowed the development of oil & gas resources that were previously considered uneconomic. The dramatic changes in the sector offer new commercial opportunities for U.S. oil & gas equipment manufacturers to penetrate new markets, gain share in existing markets, and revisit previously declining or over-regulated markets despite declining global oil and gas prices. These fast-developing trends also present an important opportunity for U.S. oil & gas equipment sales, especially valves and actuators, through focused export promotion efforts.

Overview of the Upstream Oil & Gas Equipment Market
The United States is home to many upstream oil & gas equipment industry companies and U.S. companies are competitive internationally in this field.
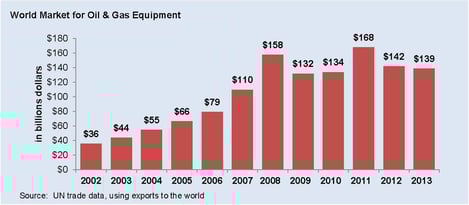
Over the past ten years, the global market for upstream oil & gas equipment has increased by a compounded annual growth rate of 12.2 percent, from $36 billion in 2002 to $138.9 billion in 2013. World exports peaked at $168 billion in 2011 but remained substantial thereafter ($142 billion in 2012). Researchers expect world exports to increase in the years ahead, consistent with intensifying demand in emerging markets and growing demand for innovative upstream technologies in which U.S. companies excel.
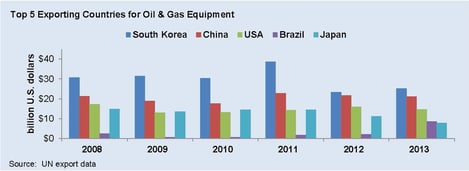
The significant market growth over the previous decade demonstrates expanding energy needs worldwide and increased demand for equipment within this sector. Today the United States is the world’s third largest exporter of equipment in the oil & gas sector, with close to $14 billion in exports. In 2013, Korea represented 18 % of global exports; China represented 15 % while the United States represented 10 % of these exports by value. However, the United States’ share of the global market for equipment is shrinking, while exports from the United States are projected to reach $19.1 billion by 2018, the total of U.S. global market share is projected to decline to below 10 %.
The changes in the international oil & gas equipment market place are the result of increased competition from East Asian suppliers and greater demand for equipment within the United States. Increased manufacturing capabilities and low-cost production has allowed Chinese firms to displace U.S. market share particularly in low-tech parts and components. At the same time, the shale gas boom has increased demand for equipment, both foreign and domestic, in the United States, decreasing U.S. exports.
It is important to consider the nuances of the oil & gas industry when evaluating international opportunities. The oil & gas industry includes a wide variety of products and thus the export profile of the United States varies considerably relative to other markets. Some markets that are long established oil & gas producers demand capital-intensive high-tech seismic and drilling equipment, while other markets that have just discovered oil & gas resources seek to import for more conventional drilling equipment and services for infrastructure development.
Regardless of market, U.S. exports are often differentiated from those of other countries by type—U.S. exports are particularly competitive in high end sinking and boring parts and parts for derricks, whereas those from Korea are concentrated in vessels with derricks with little sinking or boring parts and those from China are concentrated in vessels with drilling platforms and equipment and pipe. These trends will likely continue with U.S. exports weighted more toward specialized high tech exports especially relating to unconventional oil & gas production.
The projected increase in demand for exports of oil & gas equipment products may be further driven by the fundamental changes in U.S. oil & gas production in the last several years. Having been among the first in the world to develop unconventional and ultra-deep-water resources, U.S. equipment manufacturers and service suppliers have the opportunity to seize the first-mover advantage in overseas markets that are seeking to emulate the United States’ rapid expansion in energy production.
In addition to being a large exporter, the United States is also a large importer of oil & gas field equipment and pipe. With about $12 billion in imports in 2013, the United States was the largest importer of oil & gas equipment, purchasing about 9 percent of all global oil & gas equipment sold worldwide. Other large importers include Singapore with a 6 percent share of global imports, as well as the UAE, Mexico, Netherlands, Canada, Norway and China, which each capture three percent.
Recently, the value of U.S. imports and exports began to converge, likely as a result of increased investment and production in unconventional resources such as shale gas and shale oil, as well as increased investment in the Outer Continental Shelf in the U.S. Gulf of Mexico. Although the equipment sector is having an increasingly negative impact on the U.S. balance of trade, the decline in exports represents an increase in oil & gas activities and foreign investments in the United States’ oil & gas sector overall.
Export Strategy in a Risk/Reward Context
The oil & gas sector can generate large profits, but has always been characterized by a high degree of risk. Oil & gas companies are faced by a number of risks not only related to finding oil or gas under the ground, but also financial, political and security risks that exist above ground.
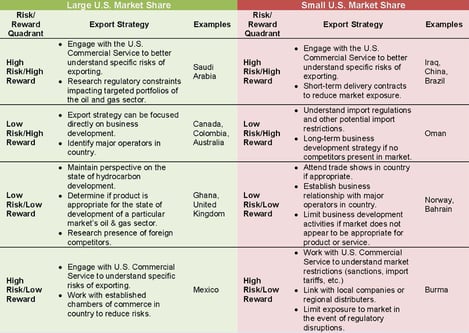
Above is a risk-reward matrix, which illustrates each country’s relative upstream risks and rewards. The rewards are heavily weighted toward below ground resources, while the risks are more weighted toward above ground government policy. In a case such as Norway, which has large oil & gas reserves, a company might encounter few unanticipated regulatory challenges (i.e. low risk), but would also have lower profits (i.e. lower reward) from investments. In contrast, a country such as Ghana may potentially yield significant profits in the oil & gas equipment sector, but there are a greater number of risks (i.e. import regulations, corruption, infrastructure constraints) that companies will have to consider when conducting business there.
Analyzing markets against the risk/reward matrix provides a framework by which exporters can apply strategies for markets based on specific criteria, and then define a set of export strategies focused on oil & gas equipment exports that will have different options for specific markets. Segmenting those markets with large U.S. market share and small U.S. market share will impact the types of commercial export strategies that could be deployed.
The matrix has been divided into two sections reflecting the market share captured by U.S. oil & gas equipment exporters already in the market. As U.S. companies have flexibility in terms of selecting target markets, the extent to which U.S. exports have penetrated a particular market is an indicator of the ability of supporting additional U.S. companies to export to that country.
A large U.S. market share in a country indicates a more favorable commercial environment for private sector companies, while a small U.S. market share could indicate a more restrictive commercial environment. Given these macro differences, export strategies in the oil & gas sector should be adjusted and accommodate the difference respective to a country’s commercial challenges and opportunities.
Countries with little U.S. market share and low risk could indicate a number of challenges, both above ground and below ground. In Norway, for example, declining production may be impacting U.S. commercial interests, limiting U.S. market share.
In markets with little U.S. market share and high risk, U.S. exporters should consider a different export strategy. Instead, business development may be less aggressive to limit exposure to potential institutional, regulatory, or market barriers. For instance, in China regulatory challenges often present intractable barriers that keep U.S. market share low.
However, countries with large U.S. market share and are low risk should deserve more attention with a clear focus on sustained business development. Especially for companies that are new to export, exploring business development opportunities in countries with well-established oil & gas sectors with many foreign companies can reduce exposure to risk and profit loss.